2025 Tariff War: A New Challenge for Businesses and an Opportunity for Strategic Shift
The rules governing international trade are now in the midst of a fundamental transformation. In early 2025, the United States announced a major shift in its tariff policy, exerting profound effects on global supply chains and corporate activities worldwide. For multinational companies, these changes represent not only a threat but also an opportunity to build new sources of competitive advantage. What is required of business leaders is swift response and strategic decision-making.
This article organizes the background and chronological development of the U.S. tariff policy escalation in 2025 and analyzes its impact on corporate activities and global supply chains.
The Tariff War in 2025
In early 2025, U.S. President Donald Trump announced a comprehensive strengthening of tariff policy, positioning the reduction of the U.S. trade deficit and the protection of domestic industries as key policy objectives. On February 13, President Trump instructed the U.S. trade team to conduct a comprehensive investigation into trade barriers imposed on the United States by other countries and to proceed with preparations for so-called “reciprocal tariffs.”
Key Measures and Chronological Developments
- February 1
The United States decided to impose a 25% tariff on imports from Canada and Mexico (with a reduced rate of 10% applied to Canadian oil and energy products). At the same time, an additional 10% tariff was imposed on imports from China, layered on top of existing tariffs. - February 13
President Trump directed a detailed investigation into trade barriers faced by the United States, including tariffs, exchange-rate policies, and trade balances, and instructed the formulation of a “reciprocal tariff” policy. - March 4
The new U.S. tariffs formally took effect. In response, Canada and Mexico announced retaliatory tariffs. Canada imposed a 25% tariff on U.S. products, expanding the scope of affected goods from an initial CAD 30 billion to CAD 155 billion. Mexico also clarified its intention to adopt retaliatory measures through both tariff and non-tariff barriers. - March 6
The United States announced temporary tariff exemptions for certain products compliant with the USMCA (United States–Mexico–Canada Agreement). However, the duration of these exemptions was not specified. - April 2
The United States declared “Reciprocal Tariff Day (Liberation Day).” Effective tariff rates on imports from China were raised to 54%, while tariffs ranging from 32% to 44% were imposed on imports from other countries, including Sri Lanka, Switzerland, Taiwan, and Thailand. - April 3
The United States announced additional 25% tariffs on a wide range of product categories, including steel, aluminum, automobiles, and automotive parts, with the scope of application being expanded in stages. - April 9
In response to trade negotiation requests from more than 75 countries, the United States implemented a 90-day suspension of reciprocal tariffs for selected countries. China, however, was excluded from this suspension due to its declared retaliatory stance and continued to face strict tariff measures. - April 10
Tariff barriers between the United States and China reached historically high levels, with tensions between the two countries taking on a Cold War–like confrontational structure and further accelerating instability in global markets.
As of April 17, U.S. tariffs on Chinese products stood at 145% (with certain items reaching as high as 245%), while China’s tariffs on U.S. products reached 125%. China indicated that under the current tariff levels, U.S. exports to China had already lost market viability, and that China would not respond even if the United States continued to raise tariffs.
These developments raise serious concerns about their impact on the international trade system in 2025. Governments and multinational corporations alike are now facing a critical juncture at which they must reassess their economic and industrial policies. Continuous monitoring of U.S. tariff policy developments and corresponding responses by other countries remains essential.
The Economic Influence of the United States
According to the 2023 country population rankings, the United States ranks third with a population of approximately 340 million—only about one quarter of the populations of India (ranked first) and China (ranked second), each exceeding 1.4 billion.
Population and economic power are often said to be closely linked, yet why does the United States alone exert such an outsized influence on the global economy despite ranking only third in population? The reasons include the following:
- One of the World’s Largest Consumer Markets
The United States possesses the world’s largest scale of GDP and private consumption, and many countries rely heavily on exports to the U.S. market as a foundation of their economies. - Core of the Global Supply Chain
As a hub for multinational corporate headquarters, R&D centers, and sales operations, policy changes in the United States directly affect international production and logistics networks. - The U.S. Dollar as the Key Reserve Currency
A large share of international trade is denominated in U.S. dollars, meaning that U.S. monetary and trade policies immediately ripple through other countries’ currency policies and export-import pricing. - Alliances and Free Trade Agreement Networks
Through free trade agreements (FTAs) and security relationships across North America, Europe, and Asia, U.S. policies influence the structure of multilateral trade frameworks.
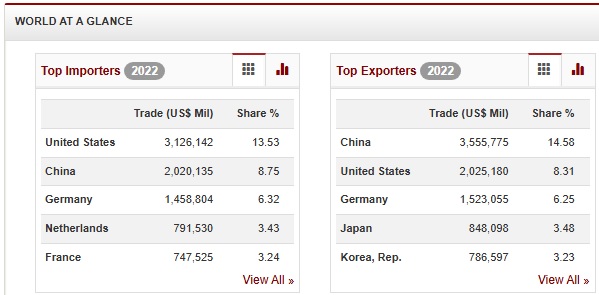
(Data of 2022)
Source: https://wits.worldbank.org/
To better understand the impact of the current global tariff war, it is essential to review historical U.S. trade trends.
The United States is the world’s largest economic power, with active trade across diverse sectors including services, manufacturing, and agriculture. According to 2024 trade statistics, the U.S. trade deficit reached a record USD 1.2117 trillion on a customs-clearance basis. This resulted from imports rising 6.0% to USD 3.2955 trillion, supported by strong consumer demand, while exports increased only 1.9% to USD 2.0838 trillion amid global economic slowdown.
| Import | Export | |
| Trends | ・Supported by strong consumer spending, imports of consumer goods—such as electronics, apparel, and automobiles—have been particularly prominent. ・In 2023, Mexico overtook China to become the largest source of U.S. imports (USD 427.2 billion). ・Imports from China declined by 20% due to U.S.–China tensions, accounting for 13.9% of total imports (down from a peak of 21%). | ・Major imported items include energy (oil and natural gas), agricultural products (soybeans and corn), aircraft, and machinery. ・Top export destinations include Canada, Mexico, and the EU. ・Trade within the NAFTA region remains highly active. |
| Major Trade Categories, Values, and Shares (Based on 2023 and 2024 data) | ・Consumer goods (electronics, apparel, toys): approx. 30% → China remains a major source; 2024 imports from China totaled USD 295.4 billion (largest trade-deficit partner) ・Automobiles and parts: approx. 15% → Major suppliers include Mexico (largest), Canada, and Japan → Imports from Japan totaled USD 68.5 billion (7th largest) ・Crude oil and petroleum products: approx. 10% → Mainly from Canada and the Middle East ・Industrial supplies and machinery: approx. 20% → Notably from the EU and Japan ・Pharmaceuticals and chemical products: approx. 10% → Increasing imports from the EU and India | ・Agricultural products (soybeans, corn, wheat): approx. 15% → Mainly to Asia (especially China) and the EU ・Aircraft and transportation equipment: approx. 15% → Including Boeing products for EU and Asian markets ・Machinery and electronic equipment: approx. 25% → Including semiconductors and computer-related products ・Chemical products and plastics: approx. 10% → Exported in response to global demand |
| Major Trading Partners and Shares (Based on 2024 data) | Mexico: 15.7% (USD 427.2 billion; overtook China in 2023) China: 13.9% (USD 295.4 billion; largest trade-deficit partner) Canada: approx. 13% Japan: approx. 5% (USD 68.5 billion; 7th) EU (Germany, France, etc.): approx. 15% | Canada: approx. 18% Mexico: approx. 16% China: approx. 8% (USD 147.8 billion) EU: approx. 20% Japan: approx. 5% |
Summary
The tariff war of 2025 is not a temporary trade dispute but a critical signal of a reorganization of the international economic order. While companies face rising procurement costs and trade risks, they also have opportunities to create new value by reassessing production locations and redesigning regional strategies. Going forward, business management will require flexible, long-term strategies that assume ongoing changes in trade policy. Rapid information gathering, analysis, and the establishment of company-wide risk management frameworks will be the key to navigating an increasingly volatile global environment.
In the next article, we will examine the impact of this tariff war on the United States and China, which has not requested trade negotiations and has repeatedly responded with retaliatory tariffs.
Feel free to contact us
MAY Planning provides advisory services on supply chain restructuring and shifts to local and third-country markets. We also offer support in optimizing import-export strategies, production location strategies, and monitoring policy trends and trade agreements.
References:
1)トラオ. (2025, April 5). 2025年アメリカの相互関税が世界を揺らす!私たちの暮らしと物価はどうなる?. Note. https://note.com/torao_aicolumn/n/na5b7b740613a
2)2025 United States Trade War with Canada and Mexico. (n.d.). Wikipedia. https://en.wikipedia.org/wiki/2025_United_States_trade_war_with_Canada_and_Mexico
3)Tariffs in the Second Trump Administration. (n.d.). Wikipedia. https://en.wikipedia.org/wiki/Tariffs_in_the_second_Trump_administration
4)michael j. lowell, philippe heeren, justin angotti, lizbeth rodriguez-johnson, kirsten lowell & courtney e. fisher. (2025, April 16). Trump 2.0 Tariff Tracker. ReedSmith. https://www.tradecomplianceresourcehub.com/2025/04/16/trump-2-0-tariff-tracker/
5)湯淑君. (2025, April 3). 比最糟推演情境還糟!川普「解放日」關稅震驚全球市場. 經濟日報. https://money.udn.com/money/story/5599/8651648?from=edn_editorrelated_story
6)張鎮宏. (2025, April 14). 一個美中不再貿易的全球經濟新局?川普關稅戰迫切的背後邏輯、戰略轉機與中國困境. 報導者. https://www.twreporter.org/a/hello-world-2025-04-14
7)鄭鴻達. (2025, April 17). 台灣不在關稅談判「優先五國」?郭智輝林佳龍:已經談過了!「吃苦當吃補」被砲轟,本人這樣說. Yahoo!新聞. https://tw.news.yahoo.com/%E5%8F%B0%E7%81%A3%E4%B8%8D%E5%9C%A8%E9%97%9C%E7%A8%85%E8%AB%87%E5%88%A4-%E5%84%AA%E5%85%88%E4%BA%94%E5%9C%8B-%E9%83%AD%E6%99%BA%E8%BC%9D%E6%9E%97%E4%BD%B3%E9%BE%8D-%E5%B7%B2%E7%B6%93%E8%AB%87%E9%81%8E%E4%BA%86-%E5%90%83%E8%8B%A6%E7%95%B6%E5%90%83%E8%A3%9C-210002196.html
8)陳鎧妤/呂佳蓉. (2025, April 16). 白宮稱中國面臨高達245%關稅 中國官媒:文字遊戲. CNA. http